Assignment B
From Seed To Apple in New York City
Introduction
Let's paint the picture! A boat filled with tired but hopeful families glides across the still morning waters. They have all left their old homes for the promises and opportunities of the new world. In the distance, through the mist, a statue the size of a skyscraper breaks through the morning fog. The mood among the seaworn travellers brightens, realizing that they have finally arrived at their destination. Soon after, a skyline of actual skyscrapers paints the horizon and the bustling sounds of city life fill the air. Sounds familiar? If not, here's a picture to help!
A Hazy View of Travellers Greeting the Statue of Liberty

New York City is undeniably one of - if not the most influential and renowned city in western society. In many ways, the city encapsulates the idea of The American Dream, with its buzzing streets, opportune business life, and rich cultural scene, spawning sayings like "if you can make it here, you can make it anywhere". Pop cultural references to New York City is omnipresent in western movies, music, and art and each year millions of turists from all over the world flock to the city see all the "familiar" places in real life. The City That Never Sleeps, the Capital of the World, the Big Apple - New York City has earned itself many nicknames. The city has the second highest GDP in the world, and continues to be the largest city in the US for over 200 years with a population of around 8.5 million people today. Professor of economics at Harvard University, Edward L. Glaeser, states that "While Boston's history is one of ongoing crises and reinvention (Glaeser 2005), New York's is one of almost unbroken triumph" (Glaeser 2005:1). But what could be the explanation for New York City's urbanizational triumph over the past 200 years?
Answering this question is a complex task - way too complex for this short data story. Rather, what we seek is to gain a better understanding of New York City's so-called unbroken triumph as a city by mapping the urbanisational development in New York City's journey from a small seed to the Big Apple using open data, visualizations and statistics. First, we'll examine the history of how New York City took the physical form that we know of today with its bustling streets and 100+ story skyscrapers. Then, we turn to those who the skyscrapers were built by and for, namely the inhabitants of New York City. How did New York City come to be the continuously most populous city in the US and what role did immigration play in this part of New York City's triumph? Subsequently, we take a contemporary look at New York City and its neighborhood from the perspective of racial segregation. In a multicultural melting pot such as New York City, which geographical patterns emerge when one observe the city through a racial lens? Ultimatly, we'll synthesise the insights that we gained throughout the three abovementioned sections and discuss where to go from here. Be sure to visit our Github Repository/Explainer Notebook for a more in-depth presentation of the data processing behind our analysis. For now, let's dive right in!
"The Greatest Sunset For A Sight of New York's Skyline"
So, the title for this section is a paraphrase of a slightly longer quote by the influential - and somewhat controversial - philosopher Ayn Rand. The skyline of New York City is iconic. Just as the history of hopeful immigrants arriving to New York City on boats from Europe is a central part of the city's identity, so are its towering skyscrapers. The physical appearance of the city has come to shape its economic, social, and cultural fabric. Take for instance this very popular picture from 1932 of a band of construction workers taking their lunch break on a beam floating high above the streets of New York. The picture on the right shows the characters from the hugely popular sitcome Friends, doing more of less the same thing.
The Skyscrabers of New York City


The history of how New York City came to be The Big Apple - economicaly, socially, and culturally - thus have to include the history of how the city developed its physical form. Therefore, this will also be our point of departure.
In Figure 1, we plot a temporal heatmap of the geographical development of New York City's constructional body, dating all the way from 1800 up until 2019. The red markers represent construction for primarily residential use while the blue markers indicate commercial/industrial construction. We have also outlined the five boroughs that jointly constitutes New York City: Manhattan, Brooklyn, Bronx, Queens, and Staten Island.
Please Note: Per default, the plot is paused and the "layers" controlling whether the residential and/or commercial construction are visible are both turned off. Turn the layers on through the layer-control in the top right corner and press play to initiate the temporal animation. Otherwise, feel free to zoom in and explore the construction of New York City on your own!
Figure 1: Geographical Distribution of Residential and Commercial Construction over Time
Activating both the residential- and commercial "layer" in the map and pressing play, one can see how New York City's journey from seed to apple started with residential- and industrial life making their way from Manhattan out into Brooklyn during the 19th century. Quite quickly, starting around 1900, the map becomes rather cluttered and at times one can hardly spot any of the underlying map simply due to the excessive degree of construction. Both residential- and industrial life spread rapidly out into Queens, Bronx, and Staten Island throughout the early 20th century, ultimately taking up nearly all available space in all five boroughs.
With this broad geographical impression of how the buildings of New York City arose over the years, let's get a little more specific in how we quantify construction. After all, all buildings are not created equal and it would be unfair to equate a single story house on Staten Island with a 100+ story skyscraper in Manhattan. Figure 2 displays the accumulated number of square feet constructed within each decade between 1800-2020, with all construction before 1900 grouped together.
Figure 2: Constructed Square Feet by Decade
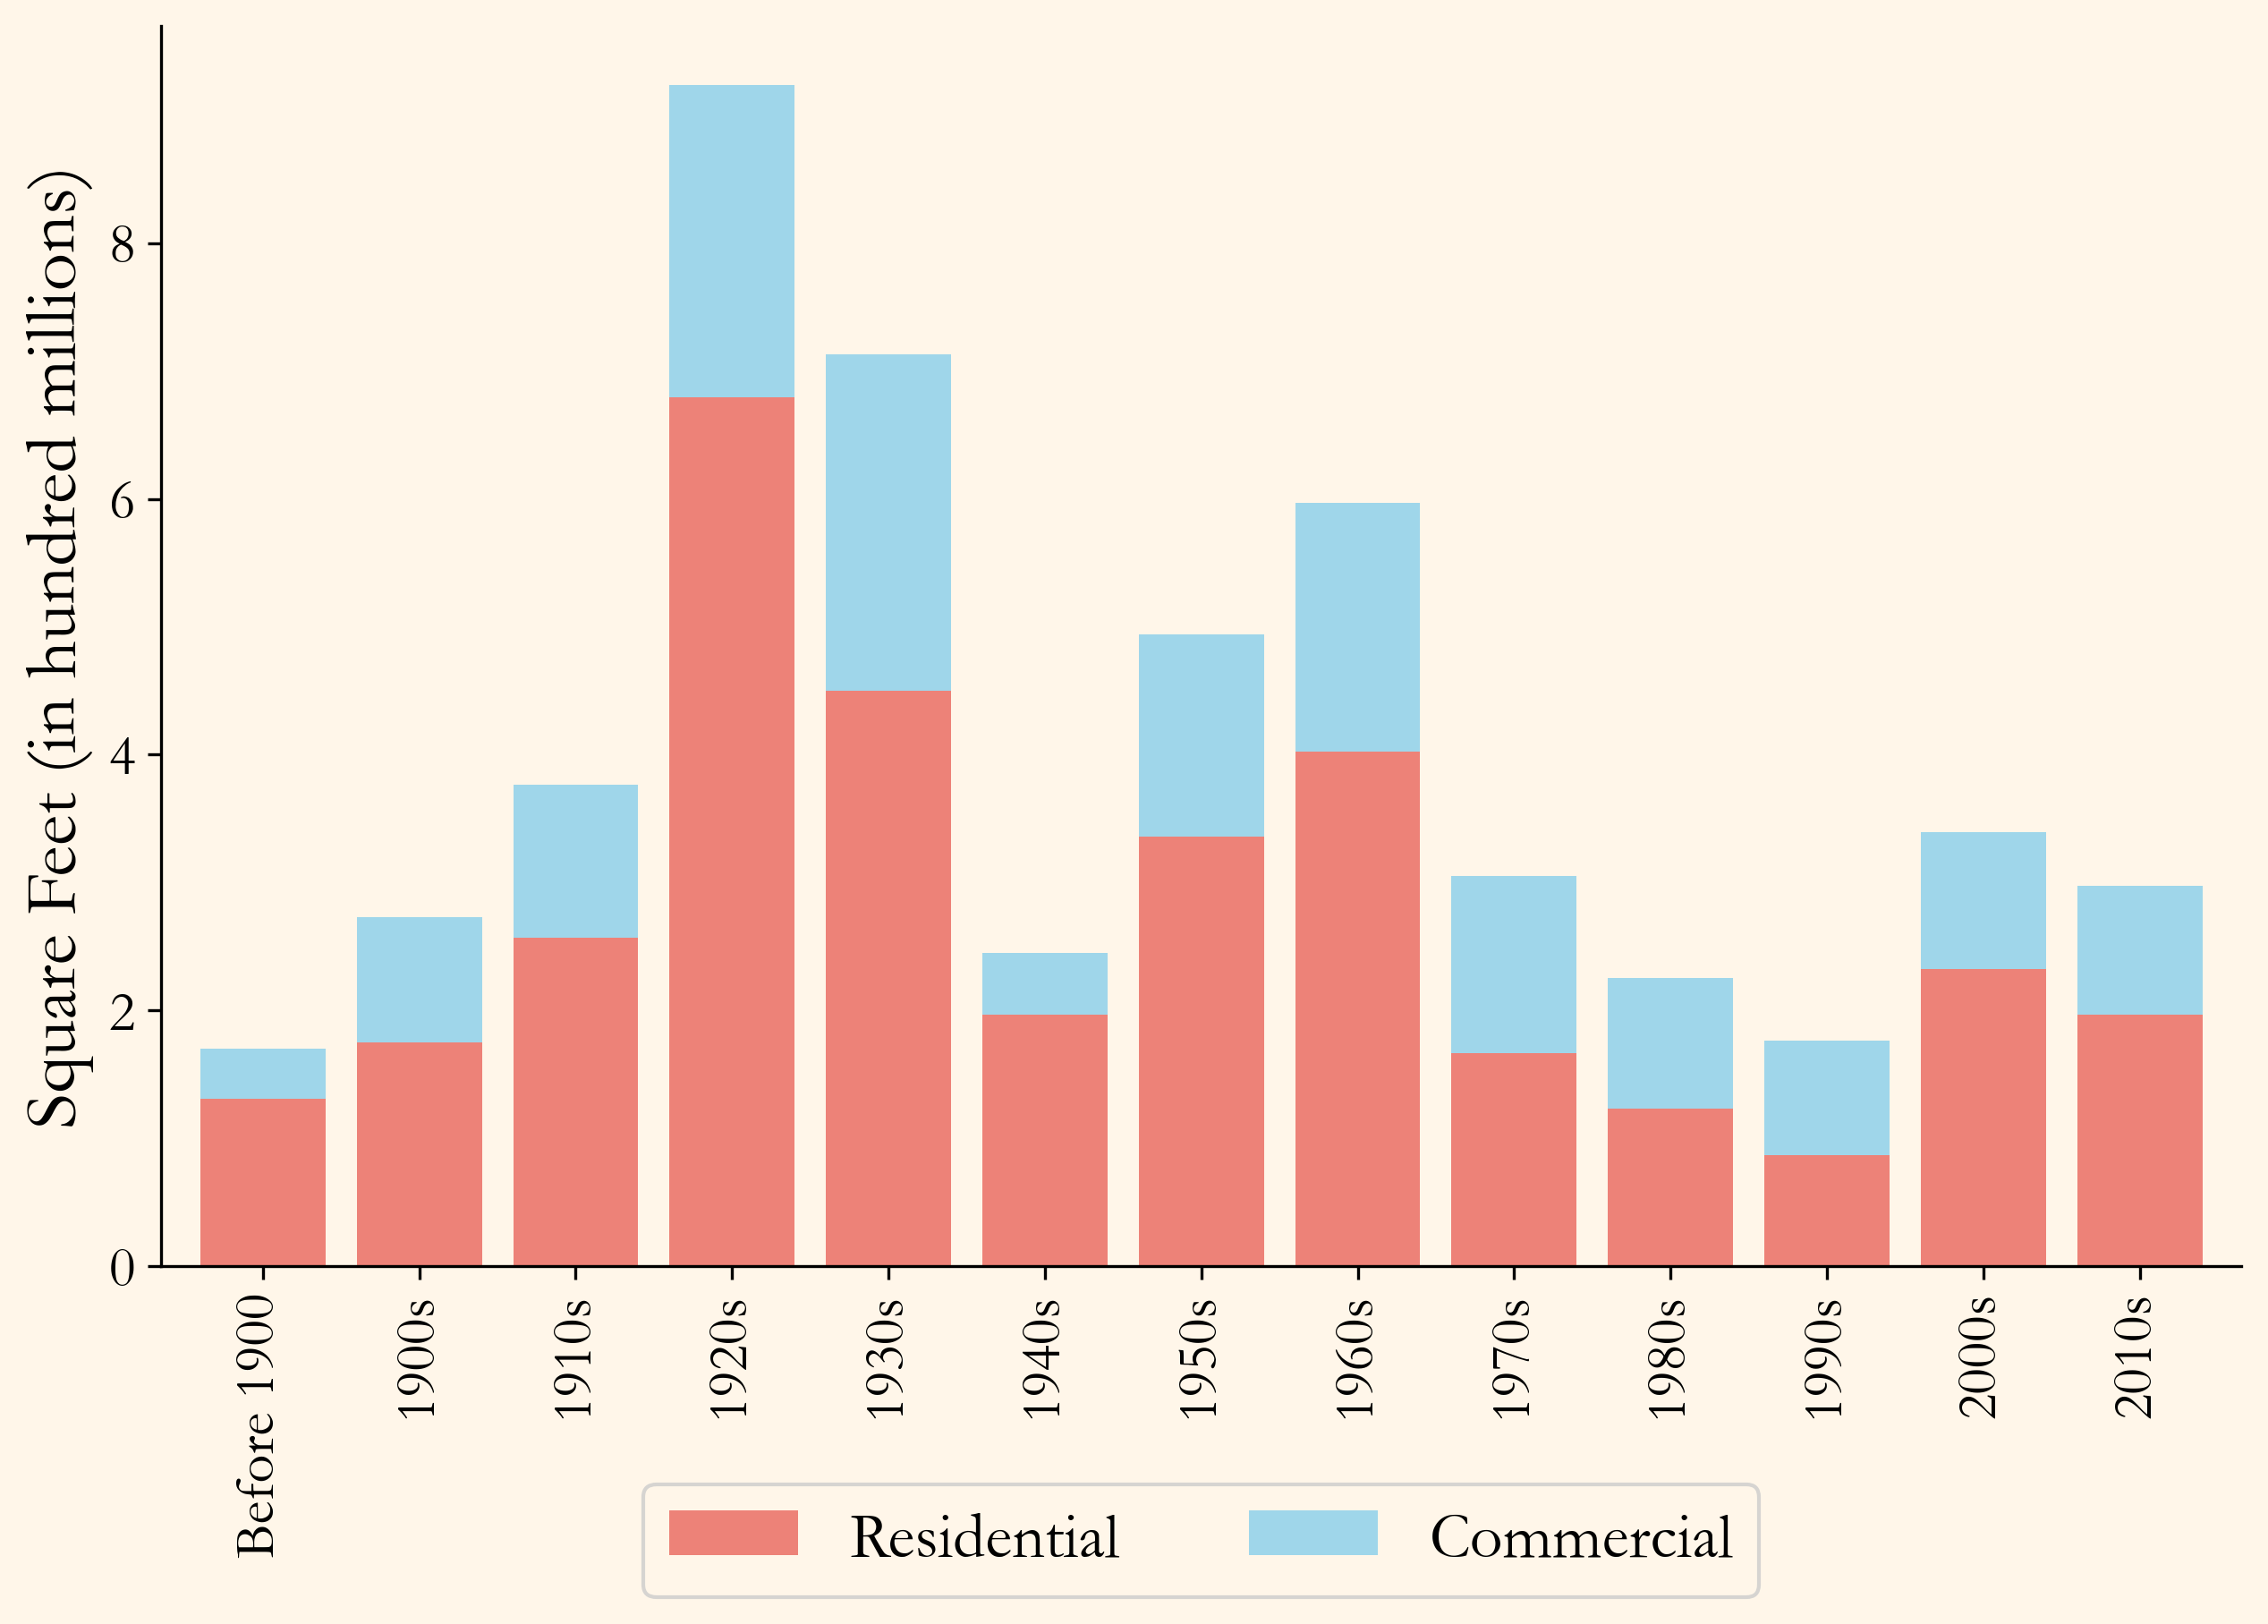
The relation between residential and commercial construction seems to be quite steady over time, with the highest share of commercial construction during the 1990s where approximately half of all construction was meant for commercial use. In the opposite end, the 1940s have the highest share of residential construction compared to commercial.
The immediatly most notable decade with regard to overall construction is the 1920s - a decade appropriately known as "the Roaring Twenties" or "the Prosperity Decade". More than 800 million square feet (roughly 74 square kilometers) of building space was constructed in New York City during that time. Nearing the end of a decade characterised by wealth, progression, and prosperity in the wake of World War I, the Roaring Twenties concluded with the Wall Street Crash in October of 1929, hurling not just New York City's economy, but the global economy as a whole into an economic depression called the Great Depression. Being a time of recession, this might be part of the explanation for the relatively lower degree of construction in the 1930s compared to its preceding decade. Looking at the 1940s (one of the least constructional decades in 200 years) and the noticeably lower amount of construction compared to its pre- and succeeding decades, it seemes obvious to mention World War II from 1939-1945 as the main reason behind this decrease. Moving on to the 1950s and 1960s, both decades are rather productive with regard to construction in New York City. Business was once again booming during the "the prosperous 50s" and "the happy 60s" (a danish nickname for the decade), and both periods are characterised by economic growth. Old habits die hard and - once again - a period of growth is followed by a period of recession. From a constructional standpoint, the 1970s, 1980s, and 1990s stand out as being among the least productive in shaping the physical fabric of New York City - especially with regard to residential construction. From a broader, historical standpoint, the 1970s hosted a global energy crisis while both the 1970s and 1980s mark a particularly challenging period in New York City's history with regard to social challenges and crime prevention. The resemblance between New York City and Batman's crime-ridden city of Gotham does not come out of nothing. However, New York City was not the only metropolis with challenges and almost every larger cities during this period fared even worse than New York City (Glaeser 2005:20).
All in all, the constructional history of New York City tells a story about the world around it. Economic prosperity/depression, social tensions, energy crises, and world wars are all manifested in Figure 2. Now, let's nuance the picture even further and examine the history of residential- and commercial construction within each of the five boroughs of New York City.
Figure 3 presents the accumulated number of square feet constructed within each decade - just like Figure 2 - but subdivided into the boroughs of New York City.
Figure 3: Constructed Square Feet by Decade and Borough
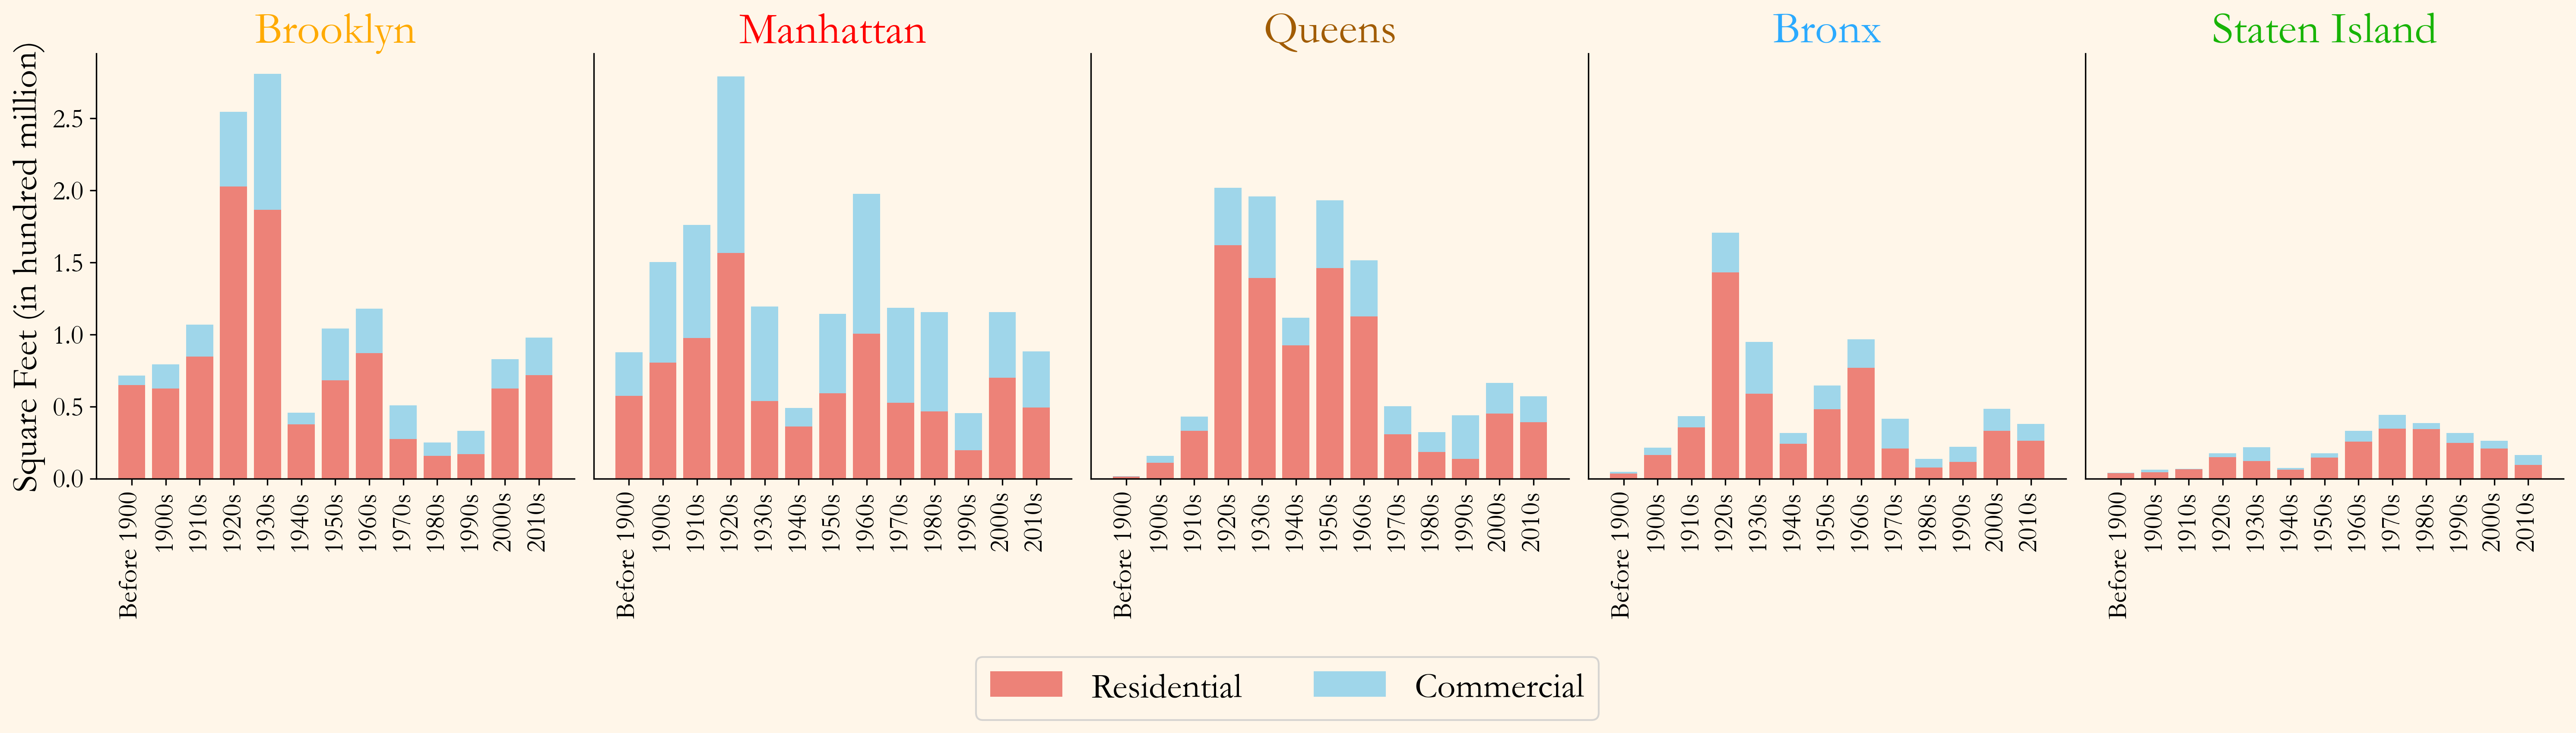
Brooklyn and Manhattan stand out as the boroughs with the highest amount of construction during a single decade. For Manhattan, that decade is unsurprisingly the Roaring Twenties, while Brooklyn actually peaks during the Great Depression of the 1930s. Compared to the other boroughs, commercial construction has clearly been prioritized in Manhattan over the years. Today, Midtown Manhattan houses New York City's Central Business District (CBD), which also happens to be the largest CBD in the world. Based on Figure 3, the foundation for this epicenter of capitalism was primarily laid during the 1920s, a period defined by commercial transformation in Manhattan.
From Figure 3, we find that not all boroughs are effected equally by the abovementioned social, economic, and political events - or at least that the events spark different reactions. For instance, while both Brooklyn, Manhattan, Bronx, and - to some extent - Staten Island all seem to be noticably effected by World War II during the 1940s, Queens retains a rather high degree of residential construction during this time period.
Lastly, it is apparent that Staten Island has considerably fewer constructed square feet compared to the other boroughs. Contrary to the others, Staten Island experienced its most constructive decades during the later half of the 20th century. This could probably be related to the fact that other boroughs are getting more and more cramped for space, while Staten Island becomes more infrastructurally connected with the rest of New York City. For instance, the renowned Verrazzano-Narrows Bridge was built between Brooklyn and Staten Island in 1964, allowing for easier commuting between Staten Island and the many square feet of commercial space in Manhattan - maybe. This highlights the importance of critical infrastructure in managing urban space and opening up new areas for residential inflow.
A City Built By Migrants
So, we now have a broad impression of New York City's journey from seed to apple from the perspective of the city's physical structure. Next, we'll turn from looking at the construction of skyscrapers to looking at those whom the skyscrapers are built by and for - the people of New York City. Just as the skyscrapers are an integral part of New York City's identity, so is the city's history with immigrants ariving from the "old world" seeking a better life in the "new world". It's not for nothing that New York has been called a city built by migrants. We'll keep the insights from the previous section on New York City's construction in mind to hopefully attain a deeper understanding of how the residents are affected by the physical construction of the city - or maybe vice versa. For instance, what happens when a city prioritizes building commercial structures rather than residential, as is the case with Manhattan? How has this affected contemporary New York City? Let's try and find out!
Figure 4 displays the development in the population of New York City from 1900 to 2020 within each of the five boroughs and in New York City in total. Population projections for the estimated population in 2030 and 2040 are presented with dotted lines.
Figure 4: Population by Borough from 1900-2040
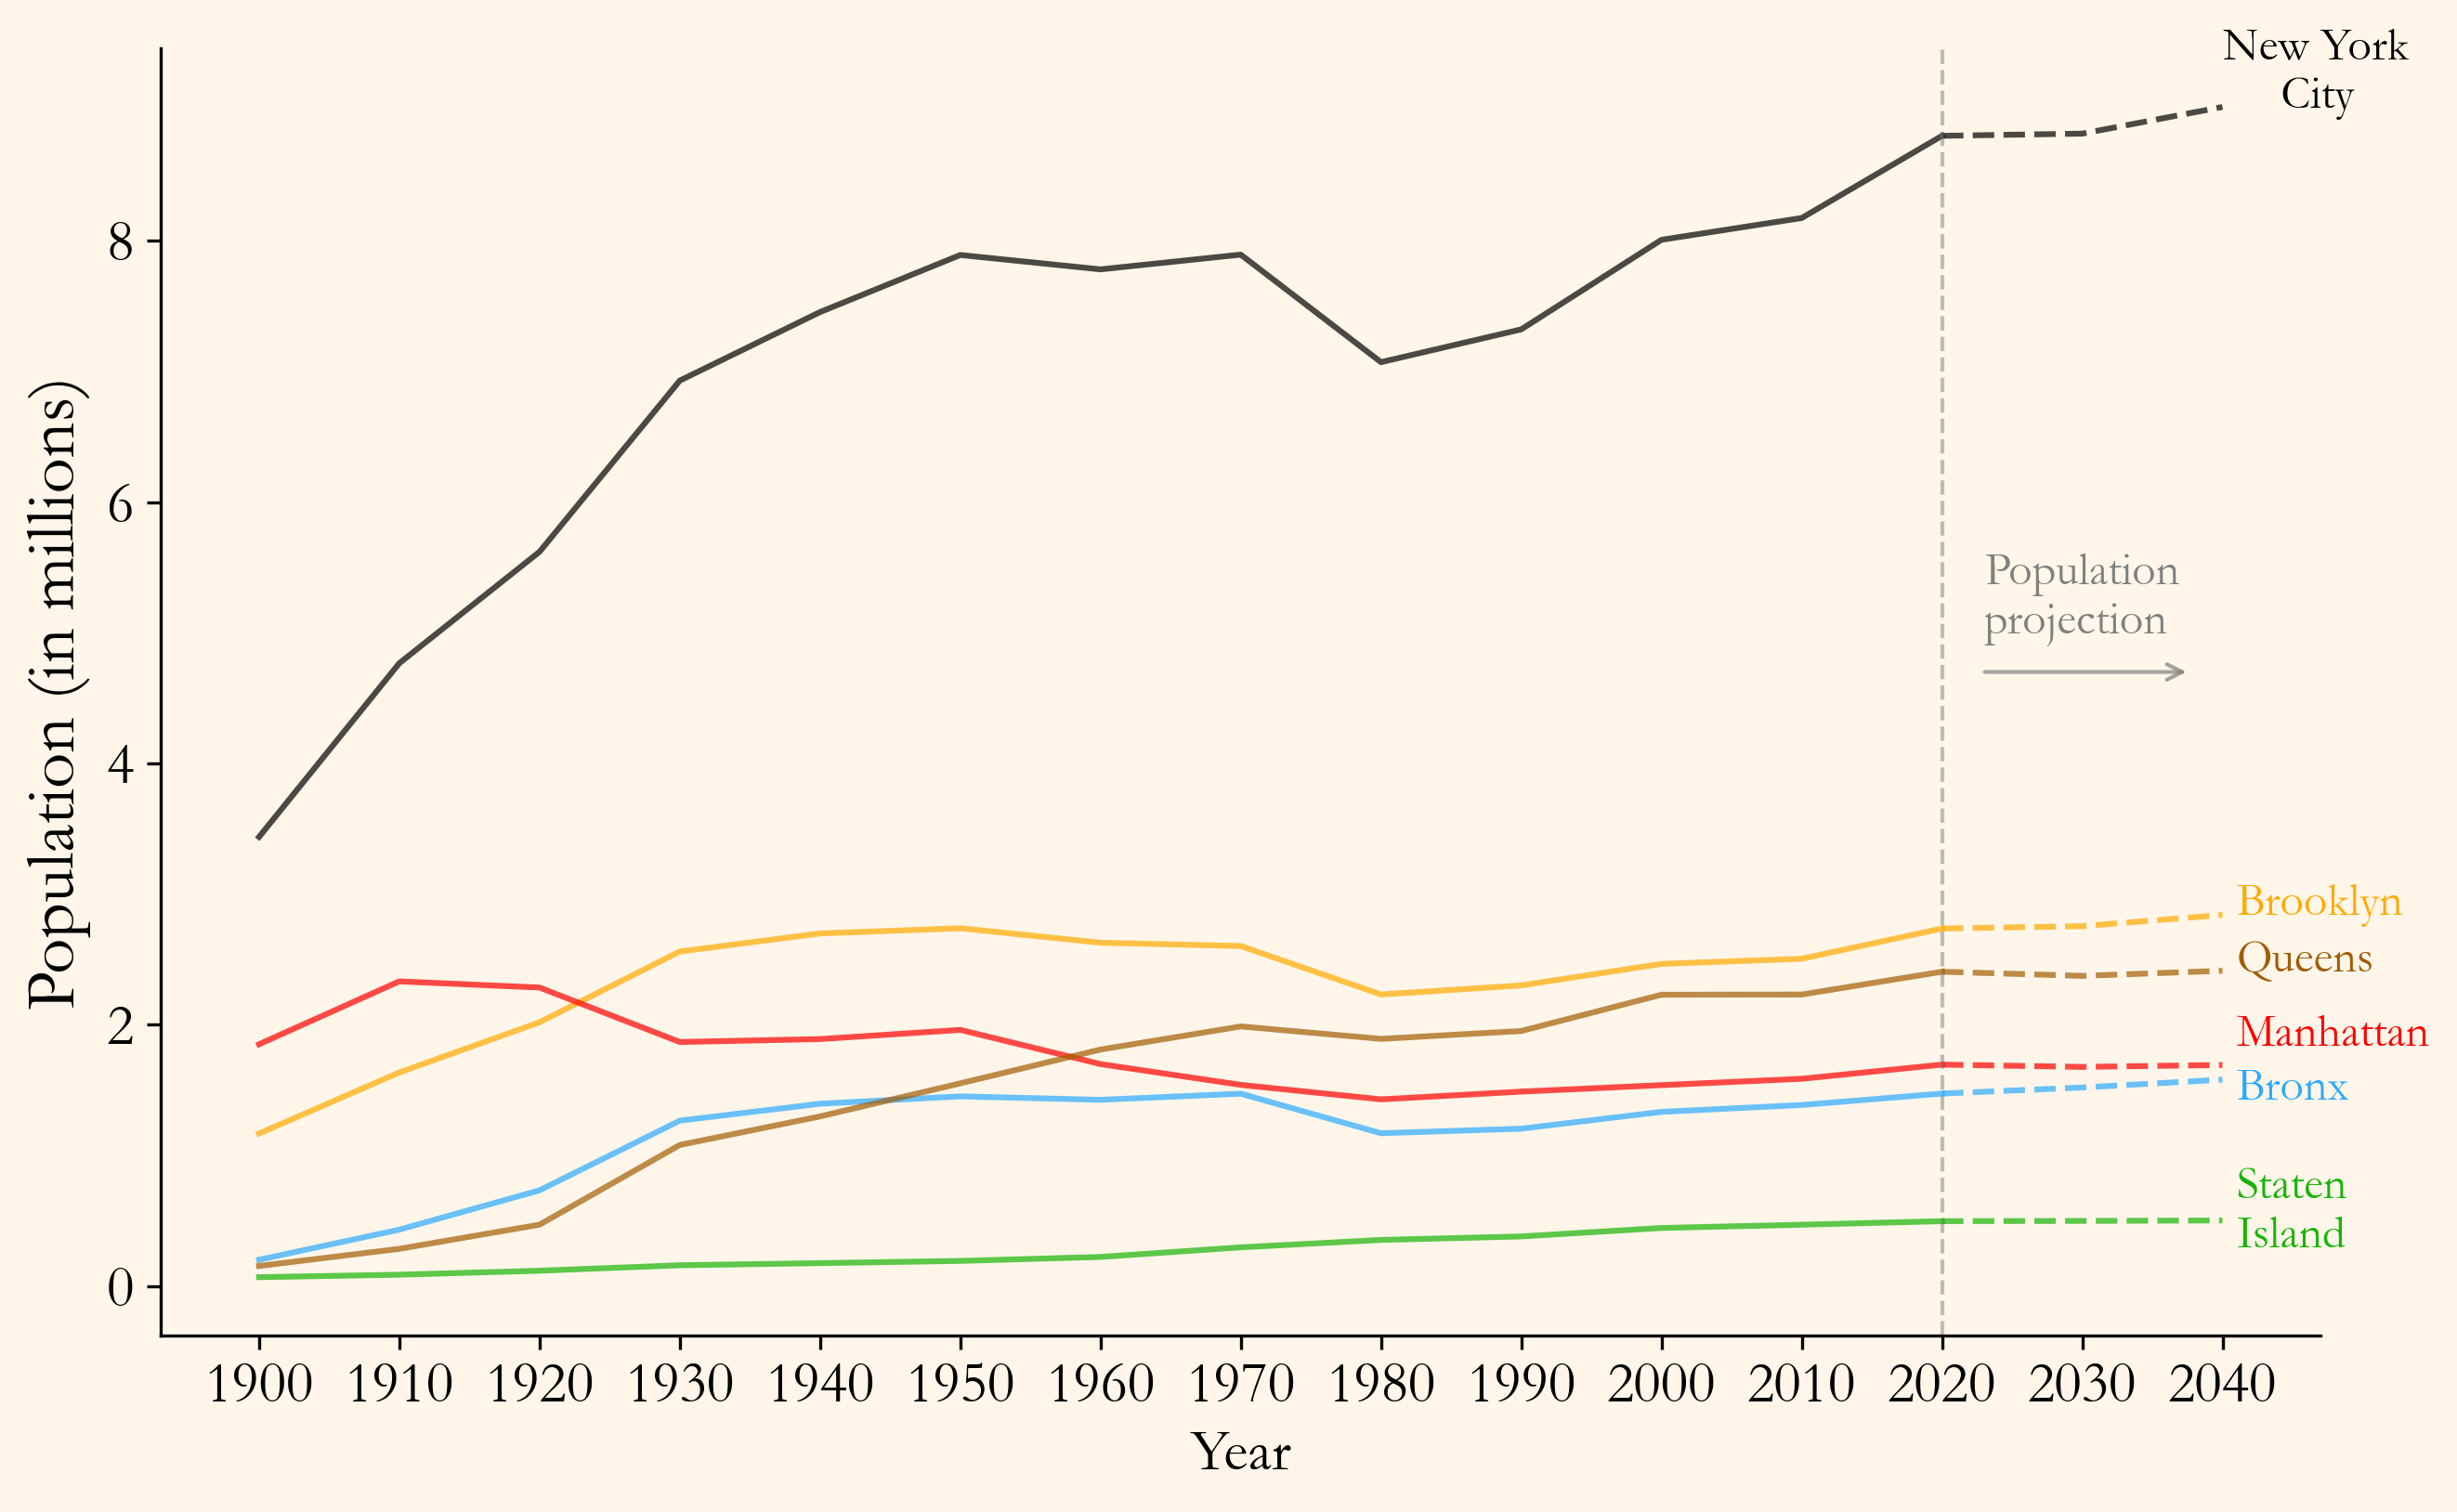
In Figure 4, we see that the population of New York City grew most rapidly during the early 20th century, roughly doubling in size from 1900 to 1950. Subsequently, however, the population growth staggered and even decreased between 1970 and 1980. Since then, the overall population has been steadily increasing for each decade, and based on the population projection, this growth will continue in the coming decades.
Looking at the individual boroughs, Brooklyn and Queens have undergone the most significant population growth, with Brooklyn overtaking Manhattan as the most populous borough during the 1920s, and Queens clocking in on second place sometime during the 1950s. Recalling Figure 3, we learned that construction in Brooklyn and Queens was mostly focused on residential buildings, whereas Manhattan to a higher degree prioritized commerical construction. We now see, that while Manhattan started off as the most populous borough in 1900 - housing nearly half of New York City's population at the time - it's population has steadily decreased throughout the 20th century and will continue to do so judging bý the population projections. Soon, Bronx will probably also overtake Manhattan. The decreasing population in Manhattan is most likely a direct result of the borough's evolution into being the Central Business District of the world, thus pushing citizens out into the other boroughs.
Furthermore, we also recall from Figure 3 that construction generally descreased significantly during the 1940s in all boroughs aside from Queens. In Figure 4, we see that while Brooklyn, Manhattan, Bronx, and Staten Island hardly had any population inflow, the population in Queens actually increased quite noticably during this time. We also see, that the decrease in New York City's overall population during the challenging 1970s is primarily caused by a decrease in the population in Brooklyn and Bronx, as well as a stagnation in Queens's population growth. Though Glaeser (2003) argues that New York City did relatively well during this period of time, living in New York City in the 1970s was not "all beer and skittles". To make matters worse, the already ongoing fiscal crisis was amplified by a large movement of middle-class residents out of the city into the suburbs, leaving a hole in the city's tax revenue reserve. This movement is apparent in Figure 4.
Also in Staten Island, we see that the population is tightly linked to the constructional activity of the borough. Staten Island has a relatively small population compared to the other boroughs, but is steadily increasing its population - mostly so during the later half of the 20th century. As mentioned in Figure 3, this is probably related to the construction of critical infrastructure, such as bridges, connectiong Staten Island to the rest of New York City.
Now, let's zoom in on those who allegedly built the city; migrants - or more specifically, immigrants. Figure 5 consists of two parts; On top, it presents the foreign born population of New York City and its boroughs from 1900 to 2010. Below, the share of foreign born relative to the total population is plotted.
Figure 5: Foreign Born Population by Borough from 1900-2010
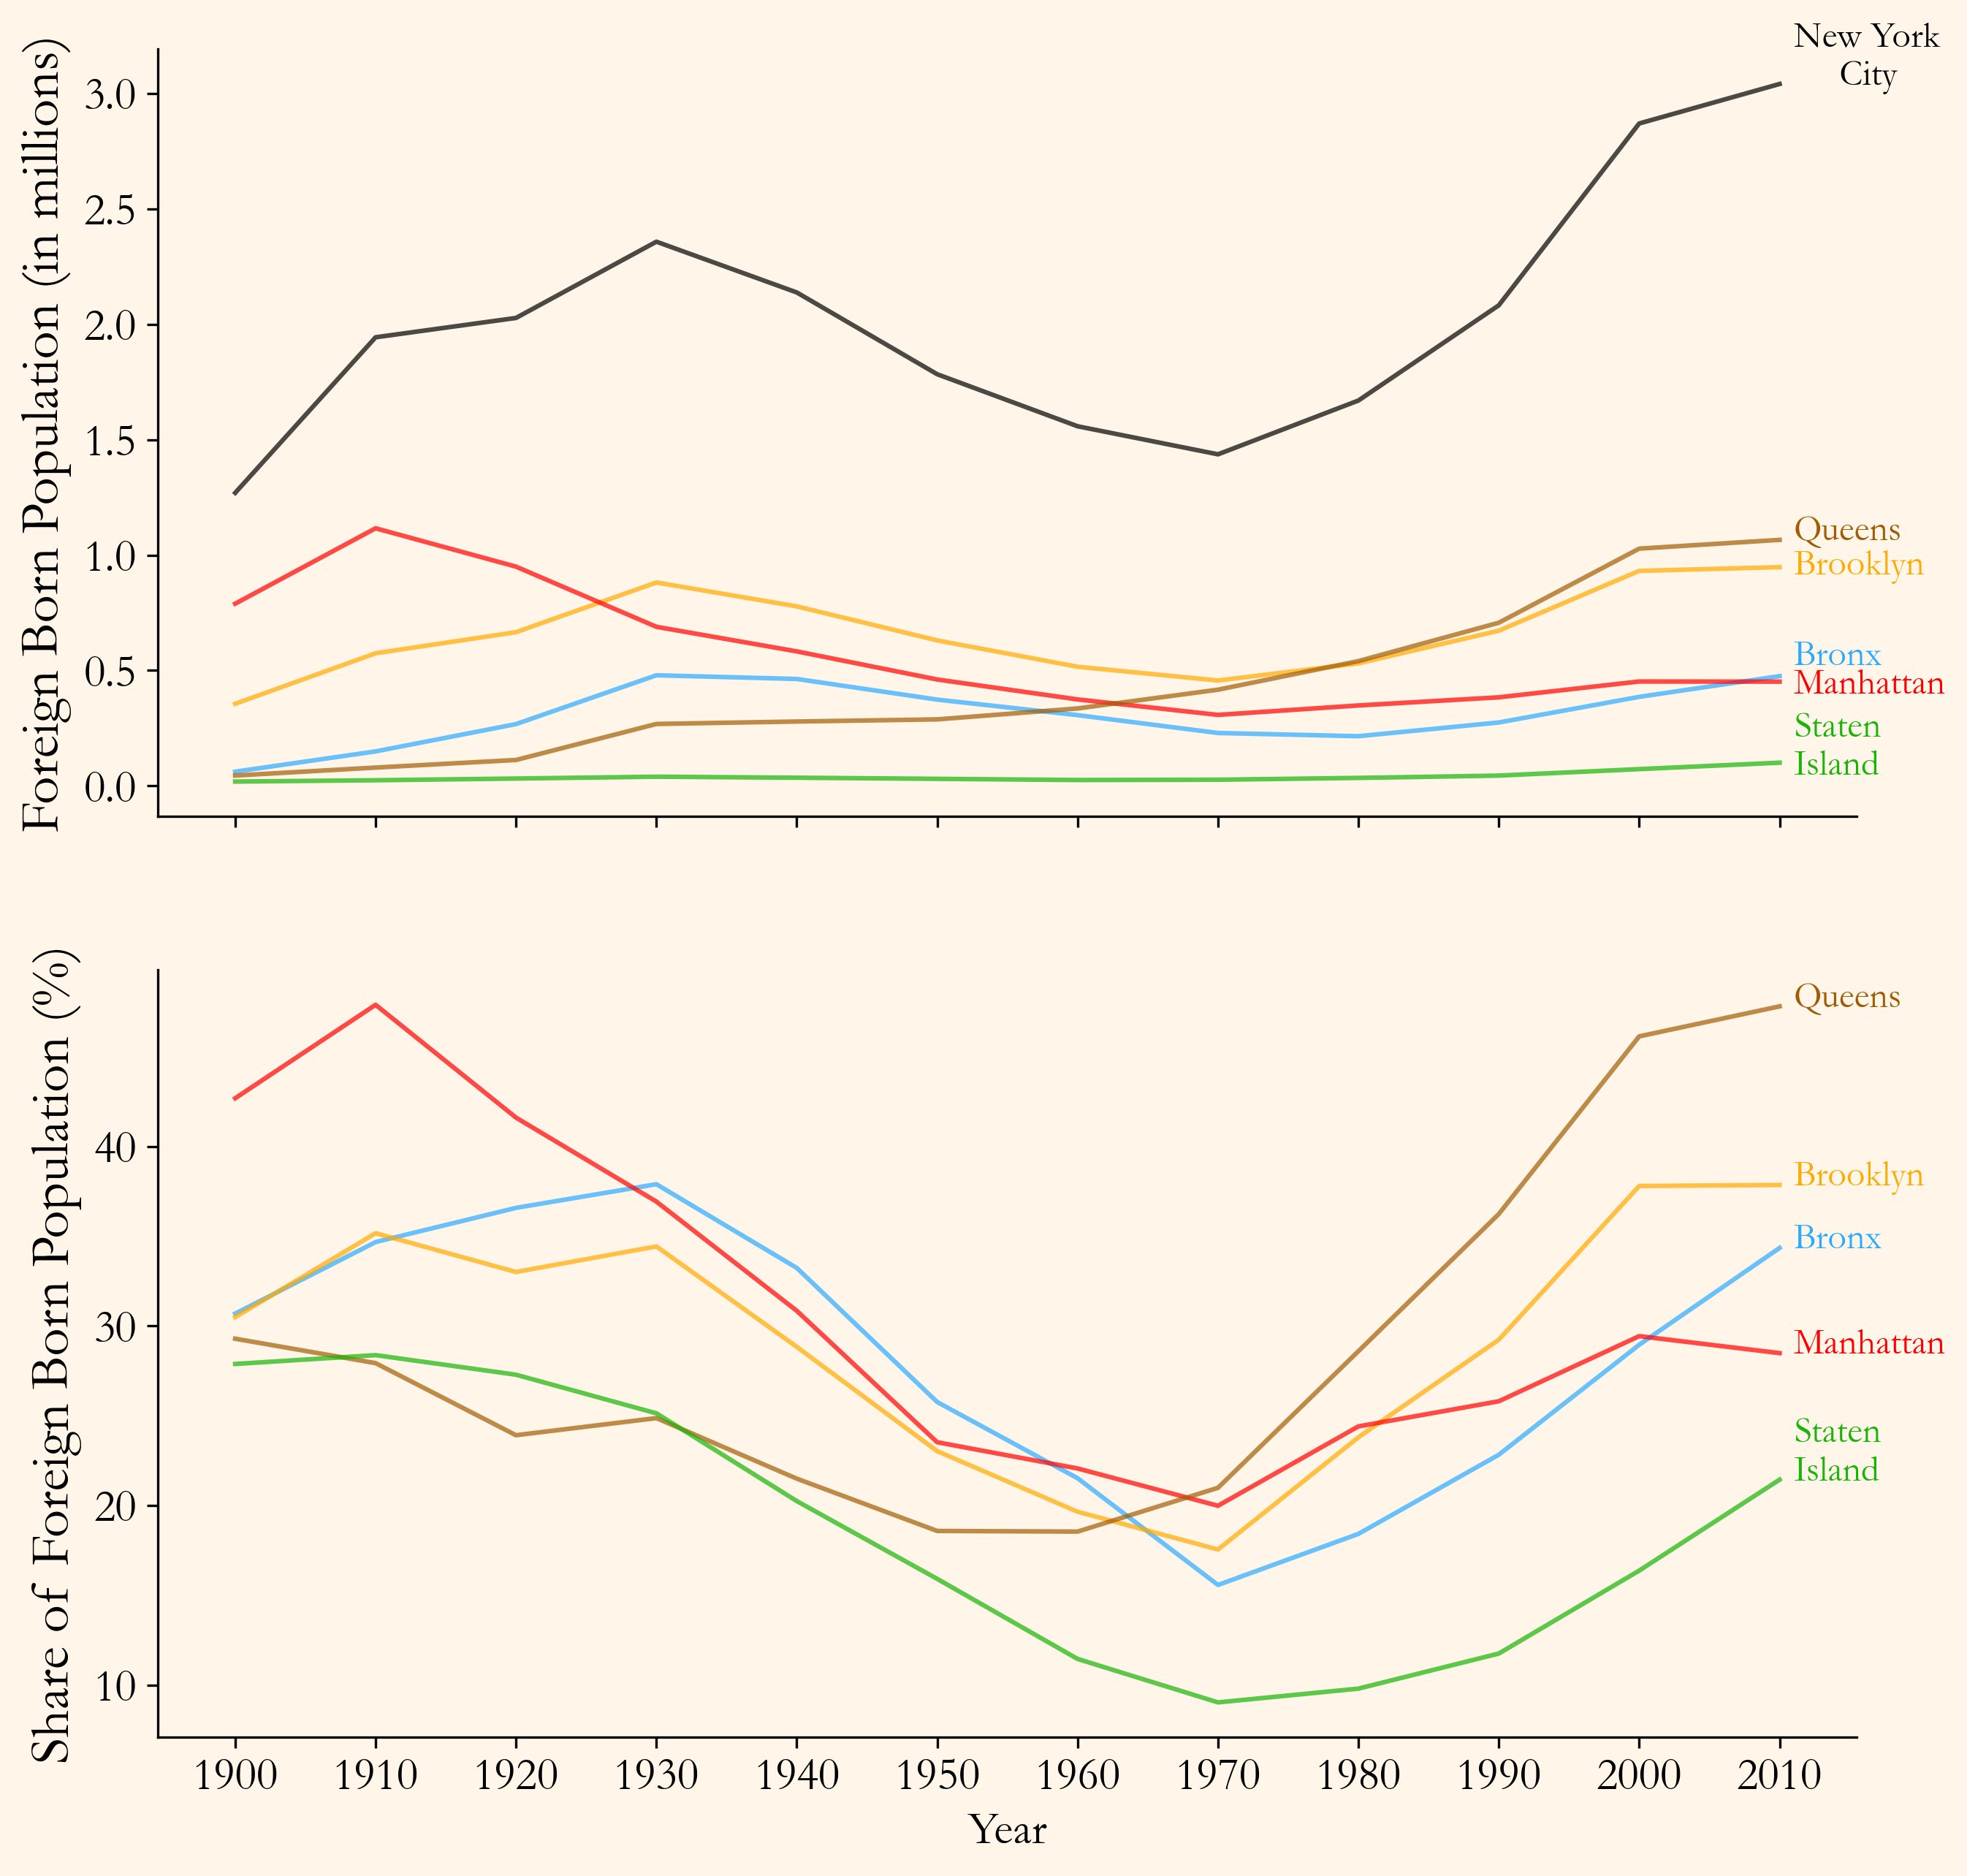
Alright, so we are back at the picture from the introduction where seaborne travellers greet the Statue of Liberty hello. In Figure 5, it is apparant that especially Manhattan consisted of a rather large share of foreign borns at the entrance to the 20th century, with almost half (corresponding to roughly 1 million people) of Manhattan's population being born in a different country in 1910. However, throughout the following decades, all the way up until 1970, Manhattan has seen a constant decrease both in the total number of foreign borns and their relative share of the total population. In 1970, only about 20% - or 500.000 people - of Manhattans population were foreign born. In fact, all of the boroughs - aside from Queens - saw a decrease in both the total and relative number of foreign borns from around 1930 to 1970 - recall from Figure 4 that New York City generally experienced a population growth during this period. We now know that this growth cannot be attributed to an inflow of foreign born migration. The drop in both the total number and the share indicate that the decrease in the foreign born population is not due to a general migration out of the boroughs of New York City, but rather because specifically the foreign born population either moves out or - well - dies. In 1921, the United States enforced a new immigration policy called the Emergency Quota Act, which restricted immigration quite heavily based on the nationalities of those already residing in the US. The Emergency Quota Act is a central part of US immigration history and is inevitably reflected in Figure 5.
From 1970 and onward, all boroughs have undergone a steady increase in foreign born residents - both in total and in the share of the population. In 1965, the Immigration and Nationality Act of 1965 was passed, abolishing the Emergency Quota Act of 1921 in favor of a less restrictive - and less discriminating - immigration policy. The effects of this law are obvious in Figure 5. The increasing foreign born population could also have something to do with the abovementioned movement of middle-class residents out of the city and into the suburbs, leaving space for foreign born residents to take up. Especially Queens have had a noticable inflow of foreign born residents. Almost inversely mirroring the development in Manhattan, Queens have gone from housing hardly any foreign born residents in 1900, to having roughly 1 million foreign born inhabitants in 2010, constituting nearly half of the boroughs population.
Bus-Proof Overpasses and Racial Segregation
New York City's triumph - as described by Glaeser (2005) - is undeniable but also rather simplified. Maybe even somewhat sugar coated. Yes, New York City is populous and contributed with a high GDP, but the city is not without its problems. We have already talked about the social distress during the 1970, with soaring crime rates, heroin and cocain abuse, and corruption. Another example of the city's history with social tension is the infamous and contested story about instructions to design certain overpasses to be too low for busses to go under them in order to keep black and Puerto Rican families away from certain areas. These racial groups would generally not own cars, thus relying on busses for transportation. Whether true or not, the existence of such stories reflects that racial tension and challenges is not a foreign debate in New York City. This section will look further into this debate.
Condensing everything we have learned, we now have a broad but solid impression of the evolution of both the physical and social development of New York City over the previous 100-odd years. Next, we wish to take a more contemporary look at New York City and how its physical and social development manifests itself in the city's residential composition today. Concretely, we want to take a look at neighborhood segregation in New York City from a racial perspective. In a multicultural melting pot such as New York City, which geographical patterns emerge when one observe the city through a racial lens. For instance, how is the relatively high degree of commercial construction in Manhattan during the 20th century reflected in the characteristics of contemporary Manhattanites?
Figure 6 show the respective share of white-, black-, asian- and hispanic/latino residents within each neighborhood of New York City. Switch between racial groups using the drop-down menu in the plot. The data is based on self-reported racial affiliation in the American Community Survey where respondents are able to choose multiple races to accommodate for mixed-race citizens. Thus, the reported share can in principle sum to more than 100% within a neighborhood.
Figure 6: New York City's Racial Composition in 2021
Overall, Figure 6 shows that the neighborhoods of New York City are highly segregated with regard to racial characteristics. Some neighborhoods are almost inhabited entirely by residents belonging to the same single racial group. The white population is the most prevalent in New York City, mainly clustered in Manhattan, Brooklyn and Staten Island. The asian population seem to live rather close to the white population. Notice for instance the small enclave in the southern tip of Manhattan (Chinatown) or the one in the western part of Brooklyn. Other than that, the asian population is mostly concentrated in the northern part of Queens. The black population is more prevalent than the asian population and is mainly concentrated over two larger areas in the southern parts of Brooklyn and Queens. Bronx also houses a noticable share of the black population. This borough, however, is predominantly inhabited by the hispanic/latino population, who also appear to have a community in the northern part of Queens. For a side-by-side comparison of the distribution of all four racial groups, click this link.
Zooming in on a particular neighborhood, Jackson Heights in the north-western part of Queens has been described as an ideal example of the diversified "melting pot" of people and cultures that New York City is often praised for being. The neighborhood has a high share of foreign born residents, 100+ languages spoken, and allegedly affordable housing prices - at least compared to Manhattan. In Figure 6, we see that Jackson Heights does contain a rather diverse mix of white-, asian- and hispanic/latino residents. However, the neighborhood only have a modest share of black citizens, ranging between 1 and 3 percent.
Maybe the idea of New York City as a highly diversified melting pot is not exactly the most fitting concept in relation to contemporary residential patterns of the different racial groups in New York City - definitely not generally speaking. Rather, Figure 6 displays a city characterized by a rather remarkable degree of racial segregation, with various enclaved communities scattered across the city and a noticable predomination of white residents on Staten Island and Manhattan. Recalling the question posed in the introduction to this section, a general characteristic of the contemporary Manhattanite would be that he/she is white...generally. Nearing the end of our data driven story about New York City's "triumphant" journey from seed to apple, we invite the reader to interact with Figure 6, exploring specific neighborhoods and their racial composition on their own.
Concluding Thoughts and What's Next?
We started our data story by pondering over New York's unbroken triumph as a city throughout the previous 200 years and counting. We sat out to gain a better understanding of New York City's triumphant journey from a small seed to the Big Apple by mapping the city's urbanisational development over the years using open data, visualisations, and statistics.
What have we learned? First, we saw how the constructional history of New York City tells a story about the world around it - both globally and domestically. Economic prosperity/depression, social tensions, energy crises, and world wars are all manifested in the buildings of New York. We also saw how a continuous prioritization of commercial construction in Manhattan throughout most of the 20th century - with a particular effort during the Roaring Twenties - allowed the borough to evolve into a capitalistic epicenter, earning Manhattan the title of the largest Central Business District in the world and positioning it as the second highest GDP in the world. Furthermore, we explored how varying legislative action toward immigration on a national level have affected both the general and the foreign born population of New York City - a city built by migrants. Lastly, we found that the idea of New York City as a highly diversified melting pot is not exactly the most fitting concept in relation to contemporary residential patterns of the different racial groups in the city. Thus, the triumphant story of New York City is not without "spectres at the feast".
What's next? We are well aware that our data narrative only tells a fraction of the story of New York City. However, it most certainly is part of the city's story. An exaustive mapping of all the numerous factors that have played a part in creating New York City is too extensive and complex for this format. We have some ideas though, on where one could continue. In the beginning of this data story, we cited Ayn Rand for saying: “The Greatest Sunset for a Sight of New York’s Skyline”. Perhaps it could be equally interesting to look elsewhere. For further data driven examination of how New York City came to be a renowned metropolis, we would find it interesting to look at the social consequences of the construction of various forms of critical infrastructure over time. We already touched upon it a bit with the construction of Verrazzano-Narrows Bridge or the story of overpasses unfit for busses. It could be interesting to dive even deeper into how single structures reflect and affect the social, economic, and policial climate of a given time. Another point of departure for future exploration, could be to build upon our examination of the historical populations in the boroughs of New York City and look at the development of and relation between housing prices and migrational flows into, between, and out of the five boroughs - perhaps using a network theoretical approach.
For now, we have only caught a glimps of the story that resides in the iconic city of New York - but what a glimps it was!
Data
Click this link to see how we did the data processing: Github Repository/Explainer Notebook
Dataset 1: Land Use in New York
Primary Land Use Tax Lot Output (PLUTO) - Figure 1, 2, and 3.
Dataset 2: Population Development and Foreign Born Population of New York
Census Information and Data - Historical Population 1900-2010, Total and Foreign Born, Figure 4 and 5.
US Census Bureau's Decinnal Census - Population in 2020, Figure 4 and 5.
NYC Planning - Population estimates for 2030-2040, Figure 4.
Dataset 3: The Racial Population in New York City Neighboorhoods
American Community Survey 5-Year Data 2021 - Race in US Census Tracts, Figure 6.
References
Articles
Campanella, Thomas J. 2017: "Robert Moses and His Racist Parkway, Explained", Bloomberg, Available at: https://www.bloomberg.com/news/articles/2017-07-09/robert-moses-and-his-racist-parkway-explained
citymayors 2020: "The 150 richest cities in the world by GDP in 2020", Available at: - http://www.citymayors.com/statistics/richest-cities-2020.html
Cohn, D´vera 2015: "How U.S. immigration laws and rules have changed through history", pewresearch.org, Available at: https://www.pewresearch.org/short-reads/2015/09/30/how-u-s-immigration-laws-and-rules-have-changed-through-history/
DiNapoli, Thomas P. and Kenneth B. Bleiwas 2016: "The Role of Immigrants in the New York City Economy", Report 7-2016, State of New York Comptroller, Available at: https://www.osc.state.ny.us/files/reports/osdc/pdf/report-7-2016.pdf
exploros 2023: "Economy in the 1950", Available at: https://www.exploros.com/summary/Economy-in-the-1950s
Glaeser, Edward L. 2005: "Urban Colussus: Why is New York America´s Largest City", Economy Policy Review. Available at: https://www.newyorkfed.org/medialibrary/media/research/epr/05v11n2/0512glae.pdf
localize 2020:"What are the most diverse neighborhoods in NYC?", Available at: https://www.localize.city/blog/what-are-the-most-diverse-neighborhoods-in-nyc/
Miller, Donald 2014: "Build for Business: Midtown Manhattan in the 1920s", entrepeneur, Available at: https://www.entrepreneur.com/growing-a-business/built-for-business-midtown-manhattan-in-the-1920s/239257
Sterbenz, Christina 2013: "New York City Used To Be A Terrifying Place", businessinsider, Available at: https://www.businessinsider.com/new-york-city-used-to-be-a-terrifying-place-photos-2013-7?r=US&IR=T
Venstre 2023, "De Glade Tressere", Available at: https://www.venstre.dk/partiet/skoleweb/politisk-historie/velfaerd-og-vaelgerskred/de-glade-tressere
Wikipedia Pages
Central Business District
Emergency Quota Act
Fiscal crisis in the 1970s New York City
Millions of turists visit New York City
National restiction law
Neighborhood for Census Tract
The global energy crisis in the 1970s
The Great Depression
The Prosperity Decade
The Wall Street Crash in October of 1929
Verrazzano-Narrows Bridge