Assignment 2
A deep dive into crime resolution
Introduction
One of the cornerstones in any functioning society is its ability to uphold law and order, enforcíng judgement on those who break the rules and norms of the collective. An accurate and effective criminal justice system is thus a central societal institution, acting as a deterrent to those who are prone to commit criminal acts, while also ensuring that victims of a crime have a legitimate place to turn to in search of justice. In reality, however, the resources of the criminal justice system are finite and crime prevention often becomes a matter of priorities. In San Francisco, the police department have undergone multiple rounds of staffing shortage, making the resources even scarcer and the need for strategic operations of paramount importance. To gain a better understanding of the resolution of crime - and lack thereof - in San Francisco, we seek to analyse this subject using SFDP's own records on criminal activities from 2003 up until 2017.
The analysis consists of 3 parts. We start by visualizing the overall development of resolved versus unresolved crime in San Francisco through the periode (2003-2017). Then, we examine the geographical distribution and development of unresolved criminal activity, looking into the many neightborhoods of San Francisco. Finally, we scrutinize crime resolution within and between different types of criminal activity and how these have developed from 2003 until 2017.
Our Dataset
When conducting a data analysis like the one we are about to present, it is essential to be transparant and clear about one's choices regarding data cleaning and structuring process. This section is about just that. The data we use for the analysis is from the San Francisco State Department's website. The data is from 2003 up to and including mid-2018. For data consistency and comparability between years, we have excluded the data from 2018 and removed duplicates from the data. We have also taken a clear-cut approach to the concept of "solving a crime", as we classify all crimes as either resolved or unresolved. Though a more fine-grained categorization is present in the data, we do not distinguish between whether for example the crime report resulted in conviction, the complainant refused to prosecute, or if a prosecution was concluded to be unfounded, etc. All three would be classified as resolved in our analysis. Lastly we have choosen to only focus on the most prevalent types of crime. These include Weapon laws, Prostitution, Driving under the influence, Robbery, Burglary, Assault, Drunkenness, Drug/Narcotic, Trespass, Larceny/Theft, Vandalism, Vehicle theft, Stolen property, Disorderly conduct. Within these 14 types of criminal activity 1.064.374 reports have been filled between 2003 and 2017. If you want to see how we did all the data processing you can follow this link to our Github Repository
The Overall Development of Crime Resolution
We start our inspection of crime resolution in San Francisco by visualizing the overall distribution of resolved versus unresolved crime reportings by year to get an initial overview of the development.
Distribution of Resolved versus Unresolved Crime Reportings by Year
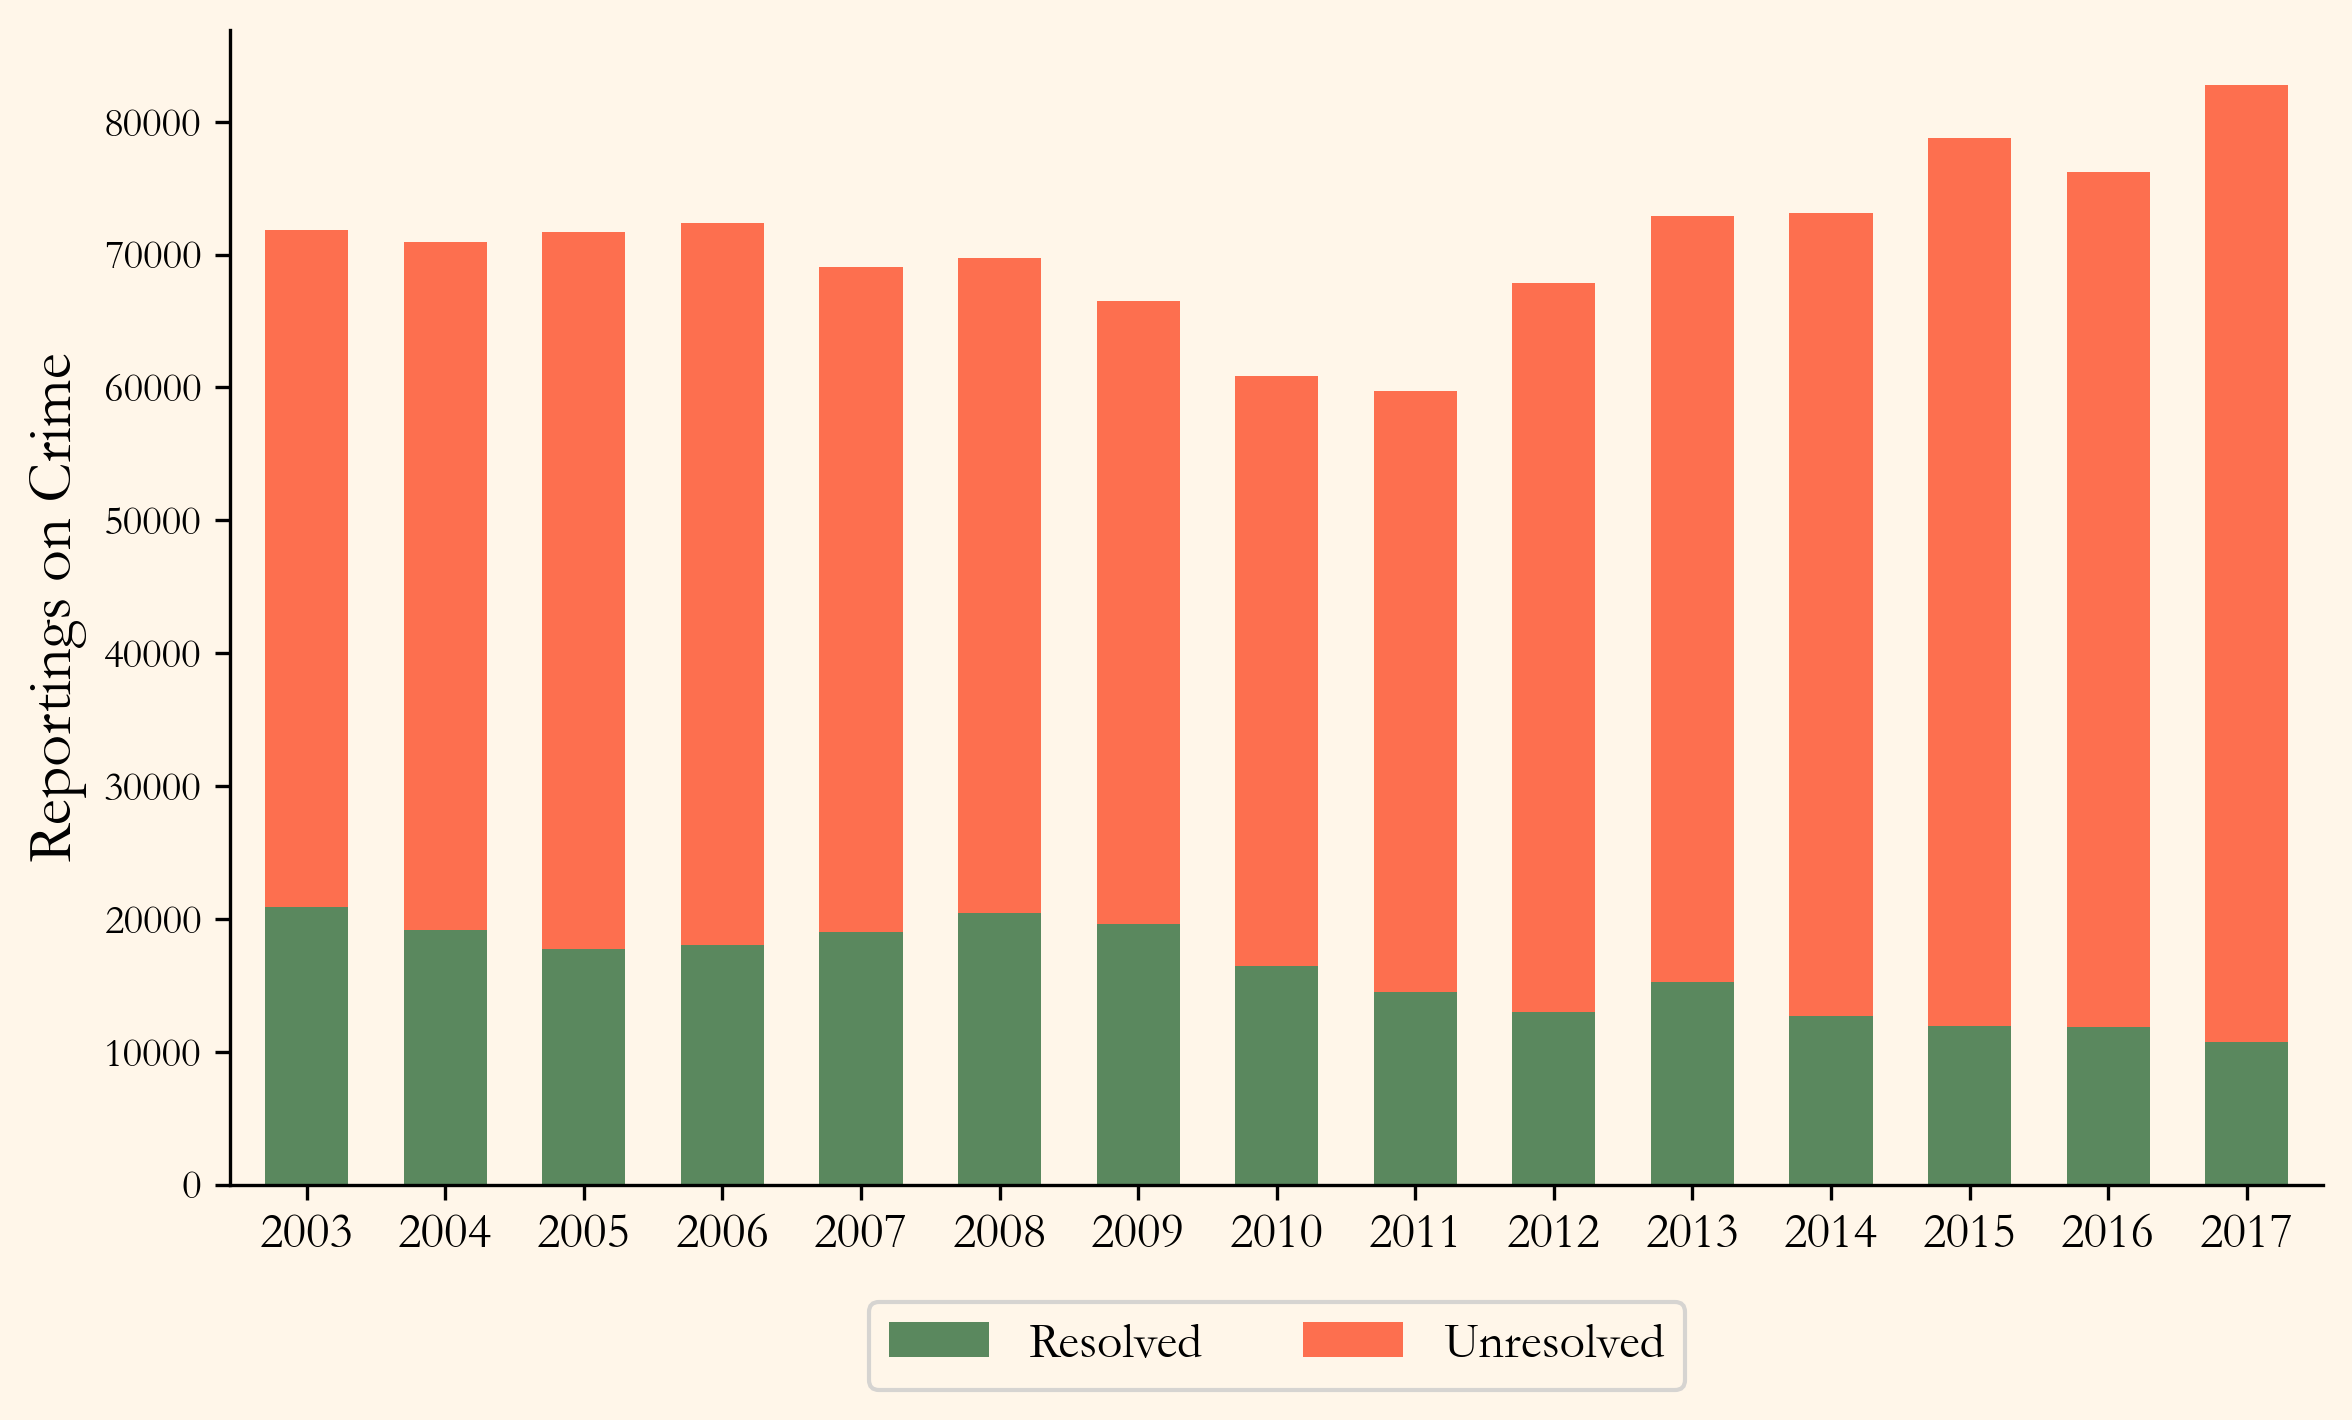
While the overall amount of criminal activity has slowly risen since 2011, the number of resolved crimes have been been steadily decreasing since 2009. In 2017, only ~10.000 out of ~80.000 crime reportings were resolved. Thus, it would look as if crime resolution is an increasing problem. As mentioned in the introduction, SFPD are continuously undergoing budget cuts, which could explain the decrease in resolved crime reportings. An alternative - or supplementary - explanation could be that an increase in crime reporting takes resources from the police department, as they have to receive and file the report, thus making it harder for them to prioritize resources in actually solving the crimes.
Now that we have a better overview of the extent of the crime resolution challenge, we can delve a little deeper. Maybe the decreasing number of resolved crimes - and increasing number of unresolved crimes - in San Francisco is driven mainly by increased criminal activity in some neighborhoods and not in all of San Francisco. In the following section, we will look into the geographical distribution and development of unresolved criminal activity.
Unresolved Criminal Activity by San Franciscan Neighborhood
The main dataset on crime reportings from SFPD contains both coordinates and district regarding the location of the crimes. With district being too broad and coordinates being to specific, we found that neighborhoods seemed to be the perfect middle ground. So, we include another dataset on neighborhood geolocation in San Francisco from the San Francisco State Department. By incorporating this data into our analysis, we can use the coordinate information from the main dataset and reverse-geocode every crime reporting into one of the 117 San Fraciscan neighborhoods.
Below, one can explore the geographical distribution of unresolved crime reports in San Francisco from 2003-2017. The plot contains three "layers" that you can access through the dropdown menu. First, it shows the geographical distribution of the total number of reported crimes. Second, it shows the share of unresolved reportings between 2003-2017 distributed into the neighborhodds. Third, it shows each neighborhood's development with regard to unresolved criminality from 2003 to 2017. The development is based on a linear regression of The share of Unresolved Crime Reportings on Years since 2003 and should be interpreted as the %-point change in a neighborhood's share of unresolved crime reportings for each passing year since 2003.
Distribution and Development in Unresolved Crime by Neighborhood
In the first "layer" of the map - displaying the total number of crime reports - it is evident that some neighborhoods suffer under a significantly higher degree of criminal activity, compared to other neighborhoods. South of Market has the highest number of reports at ~146.000 reportings, followed closely by Mission and Tenderloin. Overall, the northeastern side of San Francisco seems to have most criminal activity.
Looking into the second "layer" of the map - presenting the neighborhoods' share of unresolved crime reports - an interesting finding is that there seems to be a relatively low share of unresolved crime reportings in the aforementioned areas with the highest degree of criminal activity, i.e South of Market, Mission, and Tenderloin. Maybe the police are focusing their resources on these locations, exactly because of their high degree of criminality.
The third and final "layer" of the map shows the development of unresolved reports in the different neighborhoods since 2003. Here, we see a general - though slight - increase in the relative amount of unresolved crimes in most of the neighborhoods. This makes sense, considering what we found in the very first plot, i.e. that the amount of resolved crimes have continously decreased since 2003, while the general number of reportings have increased. Tenderloin, Golden Gate Park, and Lower Nob Hill have undergone the most negative development across the period. In the first "layer", we saw that Tenderloin is one of the areas with most criminal activity. In the third "layer", we see that on average, Tenderloin have had a 2,6%-point increase in the neighborhood's share of unresolved crime for each year since 2003. Though the neighborhood appeared to be well off judging by the share of unresolved crime across all years (see the second "layer"), the police might consider focusing their resources even further on Tenderloin to stop the negative development. On the other end of the spectrum, Parnassus Heights, Presidio National Park, Parkmerced, and Treasure Island appear to generally have succeded in bringing down their relative amount of unresolved crime since 2003. Especially Parnassus Heights and Parkmerced are interesting cases, as they do not have significantly fewer crimes in total than the other neighborhoods. Thus, it could be relevant for SFPD to look more into these two areas and take inspiration from their work.
Now that we have a better understanding of the geographical distribution of crime resolution and where the police might want to focus their resources or take inspiration from, it seems relevant to also examine if the negative development in unresolved crime is driven by a particular type of criminal activity being increasingly prevalent. Let's do that.
Unresolved Criminal Activity by Crime Type
In the plot below, we have visualised the yearly distribution of resolved versus unresolved crime reports by type of crime. One can navigate between the various crime types using the tabs in the top of the plot.
Distribution of Resolved versus Unresolved Crime Reporting by Year and Type
Inspecting the relation between crime types and resolution reveale some relevant patterns. The total amount of Larcency/theft has increase notably since 2010, while the number of resolved crimes on Larcency/theft actually have decreased slightly. This could be one of the main factors behind the overall rise in unresolved crimes in San Francisco. We also find the same pattern with Vandalism where the amount of reports has increased, while the resolved reports of Vandalism has remained steady. Weapon Laws and Trespass has increased as well, but here the amount of resolved crimes has also risen for both crime types. Vehicle Theft has seen a dramatic reduction from 2006, because of a new safety system implemented in newer cars, making them harder to steal.
The types of crime that have decreased in overall activity also appear to be the ones that are most often resolved. Prostitution, Drunkenness, Drug/Narcotic, and Driving under the influence all have a high share of resolved cases, but also seems to be following an overall downgoing trend regarding crime reports. Thus, it could seem that crimes with a high rate of resolved reports are dying out - or not getting reported - while crimes with low rates of resolved reports - such as Larcency/Theft - are becoming increasingly prevalent. This evolution of crime in San Francisco could be a main driver for the overall decrease in resolved crime reports.
Concluding Thoughts
In this mini-analysis, we have presented a short data-story on the development of crime resolution in San Francisco. We saw that both the total and relative amount of unresolved crime cases are increasing and have been doing so more or less continuously for the past two decades. We explored which neighborhoods have had the highest degree of unresolved criminal activity as well as the neighborhoods' development in that regard over the period of 2003-2017. We found that especially Parnassus Heights and Parkmerced have had a positive development with regard to lowering their relative amount of unresolved crime, while Tenderloin have seen a steady increase in its share unresolved crime. Lastly, we also examined how crime resolution in San Francisco relates to specific types of criminality. We found Lacency/Theft to be by far the most dominant type of criminal activity, becoming more and more prevalent by the year and with an increasingly low share of resolved cases.
Ultimately, crime prevention is inevitably a question of resources and priorities. Which kind of criminal activity should one solve first? and where? This small analysis shows, that over the post 20-odd years, SFPD have been dealing with a growing problem with regard to managing the slowly increasing amount of criminal activity in San Francisco. One thing is for certain: budget cuts probably doesn't make it easier.